Observing birds leads inevitably to an awareness of our planet's motion.
Earth's daily rotation leads to predictable variation in bird activity. In general, birds are most active during the morning hours (except for nocturnal species like Owls). There is a lull in activity during the middle of the day which is especially noticeable in hotter weather. Then there is a late afternoon period of feeding leading up to dark.
There are also daily flights between night-time roosts and daytime feeding areas. Many New Mexico bird-watchers are aware of such daily flights of Sandhill Cranes and Snow Geese from visiting Bosque del Apache. People are usually less familiar with the daily flights of the American Crow. Every morning Crows stream out of large communal roosts to nearby feeding areas. Every evening, the direction is reversed as the Crows return to the roost. This effect is particualrly pronounced in the non-breeding winter season.
Earth's orbit around the sun coupled with the 23.5 degree slant of its axis away from orbital plane results in our yearly cycle of seasons. The available energy for food production sweeps from south to north each spring and from north to south each fall. Birds following this flow of energy results in extraordinary migratory journeys.
Yearly bird migration results in a constantly changing mix of species at any location. The "Schematic Model" of migration in the next section demonstrates these changes.
These changes also shape the bird-watching experience during the year. Each season has a unique character with its own beauty and challenges. Thus Bird-watching provides a unique window on the seasons of the Earth.
To learn more about how the Earth's slant and orbit create the seasons Click Here for NASA Site.
Schematic Model of Migration
→ Seasons Buttons
→ Map
→ Species Circles
→ Red Rectangle
→ Arrows
- For the Rio Fernando Wetlands:
- Species Present All Year: 42
- Winter Visitors: 15 Species
- Spring Fall Transients: 49 Species
- Migrant Summer Breeders: 40 Species


These groupings from the Migration Model combine at different times of the year:
- December-February: 42 Year-round Species + 15 Winter Visitors = 57 Species
- March-May: 42 Year-round Species + 49 Tansients + 40 Migrant Summer Breeders = 131 Species
- June-August: 42 Year-round Species + 40 Migrant Summer Breeders = 82 Species
- September-November: 42 Year-round Species + 49 Tansients + 40 Migrant Summer Breeders = 131 Species
The graph below shows the effect of this on the number of species recorded over the years at the Rio Fernando Wetlands. The numbers from the model roughly reflect the number of species potentially in the area at a given time. The numbers in the graph are from actual observations for a particular week of the year recorded on eBird by local Taos bird-watchers over many years:
Graph Data: eBird. 2021. eBird: An online database of bird distribution and abundance [web application]. eBird, Cornell Lab of Ornithology, Ithaca, New York. Available: http://www.ebird.org. (Accessed: January 14, 2021.
Keep in mind the numbers in the graphs result from many different observations or many years. For a single 2-3 hour bird-watching outing, the number of species seen might range from 20 in the winter to as high as 50 during migration.
One the most well known migrants in Northern New Mexico is the Western Tanager (Piranga ludoviciana). In years with heavy migration, even people who wouldn't call themselves bird-watchers may end up talking about this species.
Here is the eBird Abundance Map for the Western Tanager:
- Breeding (red): It breeds across the west, but at higher elevations.
- Winter (blue): It appears widely across Mexico, but primarily at higher elevations.
- Migration (yellow): It migrates across the west including lower elevations.
Consider the seasonal ranges:
At the Rio Fernando Wetlands, this species is classified as a Transient. It passes through in the Spring and Fall, but moves up-slope into higher elevations for breeding.
eBird Abundance Animations:
The data used to generate this map can be used to generate a map for each day or week of the year.
Using such maps, eBird staff has created Abundance Animations which provide very useful (and beuatiful) visualizations of migration for a species:
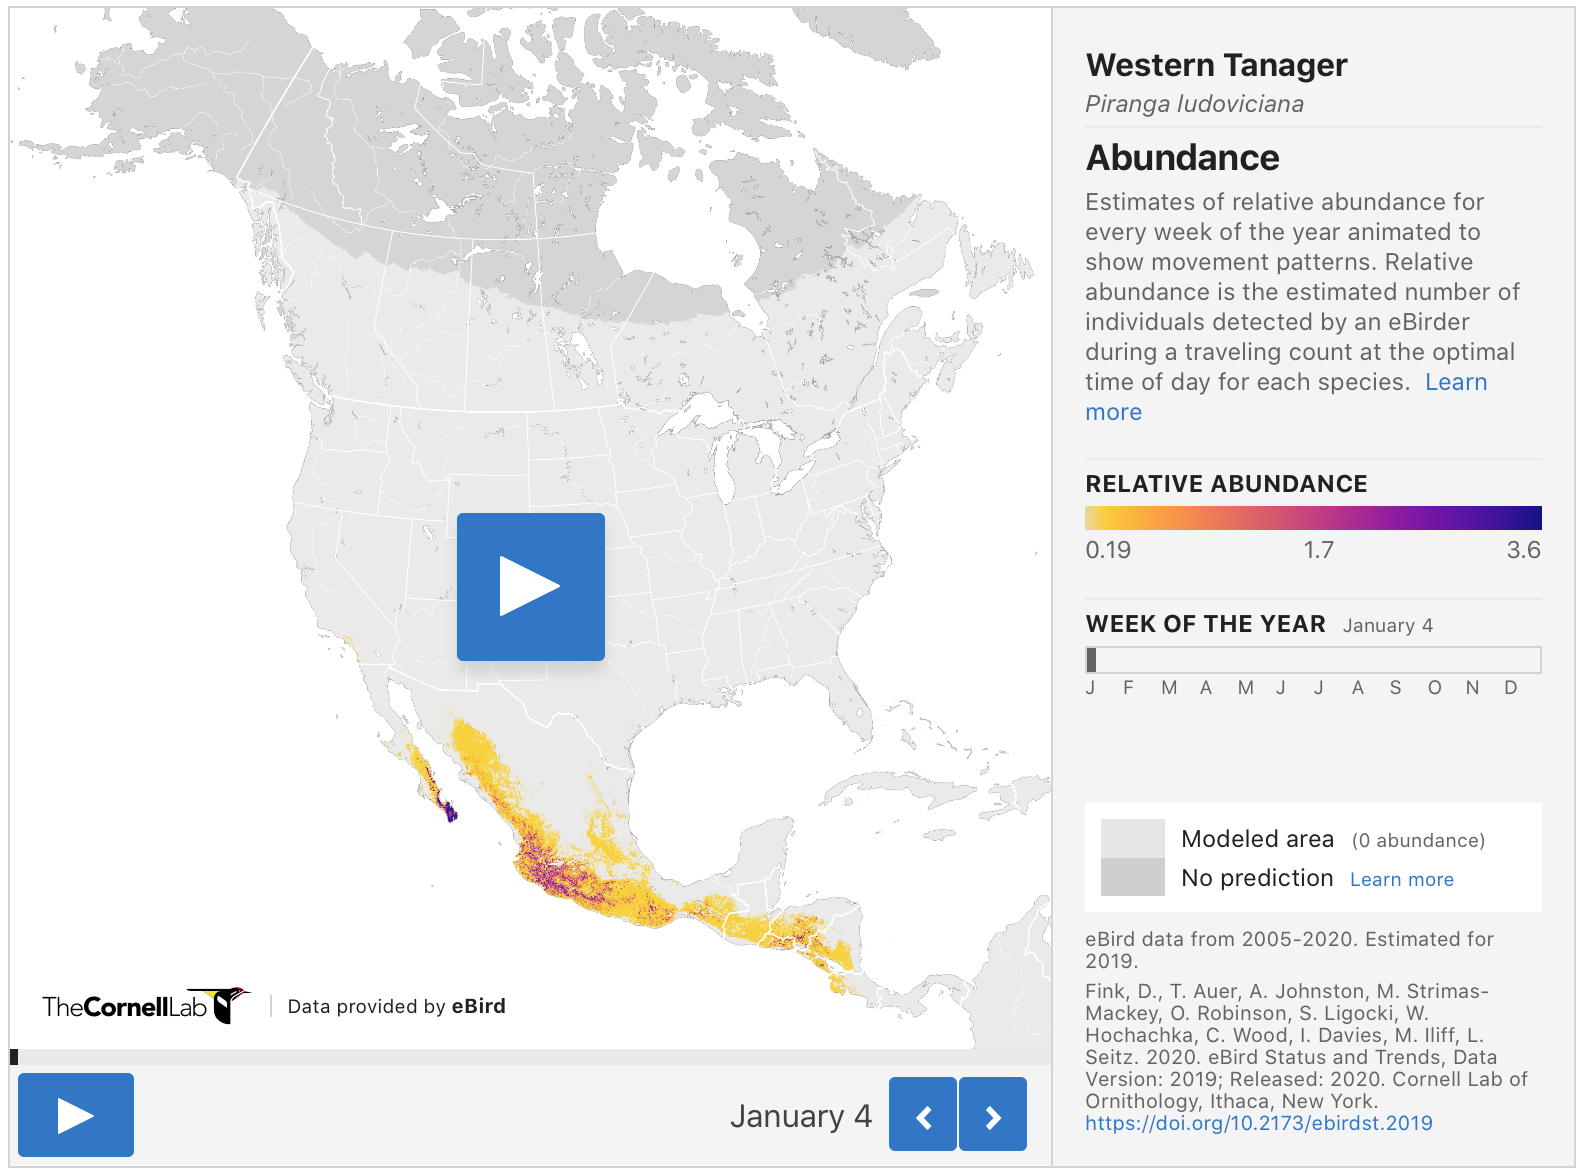
Here is a screen shot of the Western Tanager Abundance Animation.
One useful feature of the Abundance Animations is the ability to use the control buttons to stop and start at particular times.
Want to know when the Western Tanager arrives in your area?
You can find out!
Click here to see the Western Tanager Abundance Animation (Opens in separate Tab)