Link to a PDF of the BAER report: Click Here (Some useful links in report.)
The following maps were constructed using the BAER GIS Data: HPCC_Phase2_SBS_Final
They show the severity details within the Rio Pueblo/Rio Embudo watershed.
(All maps are shown with North up.)
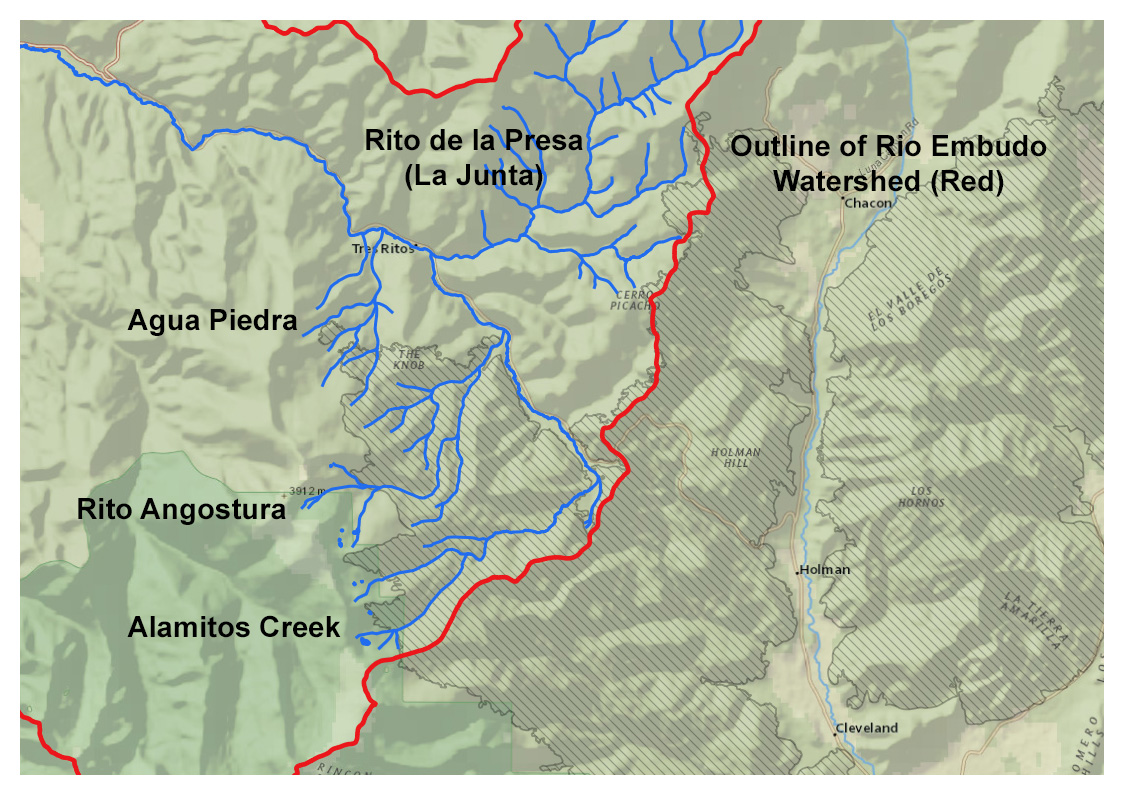
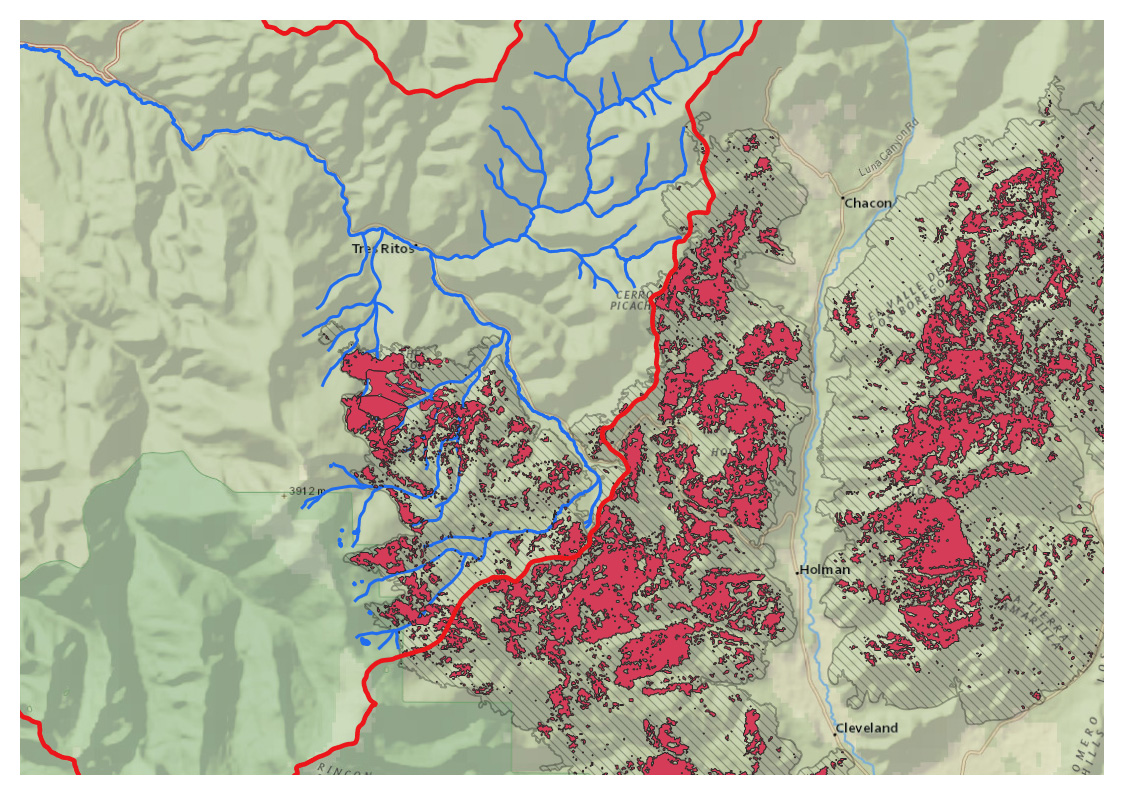
Reference Map: The hatched polygon is the outline of the fire.
The Red line shows the southeast border of the Rio Pueblo-Rio Embudo Watershed.
The four principal tributaries of the Rio Pueblo are shown.
Large portions of the Alamitos and Angostura drainages burned:
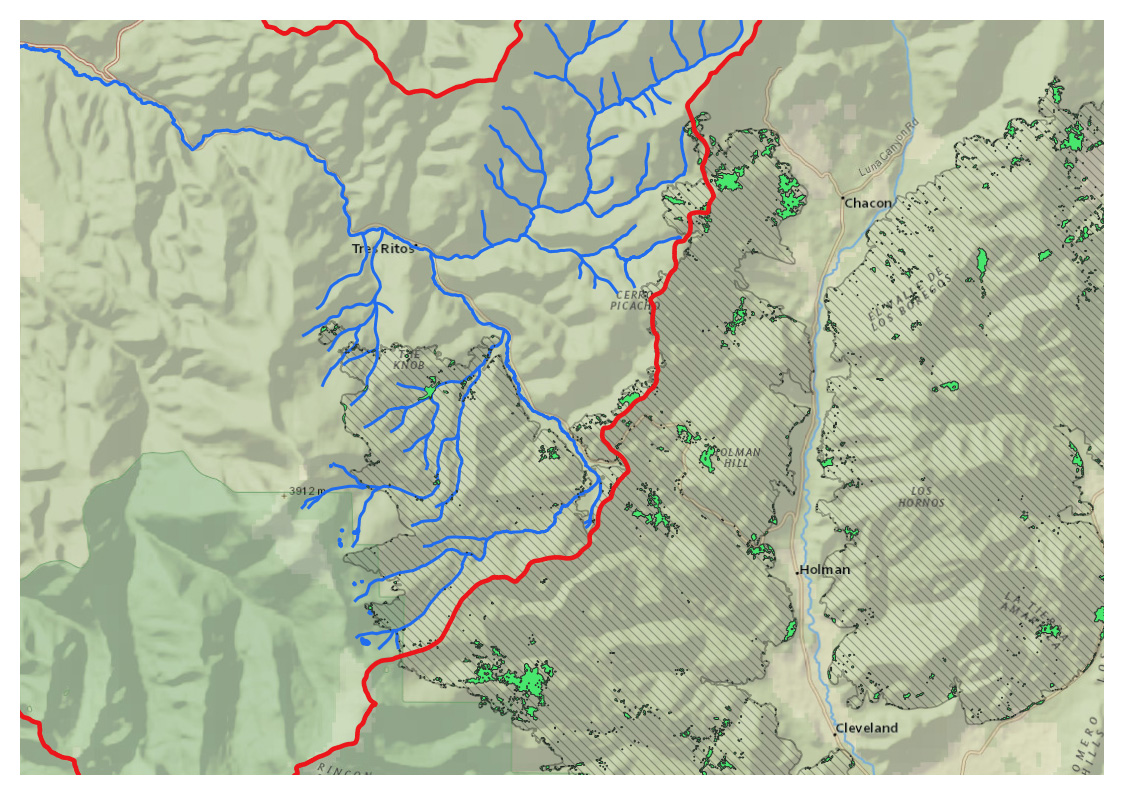
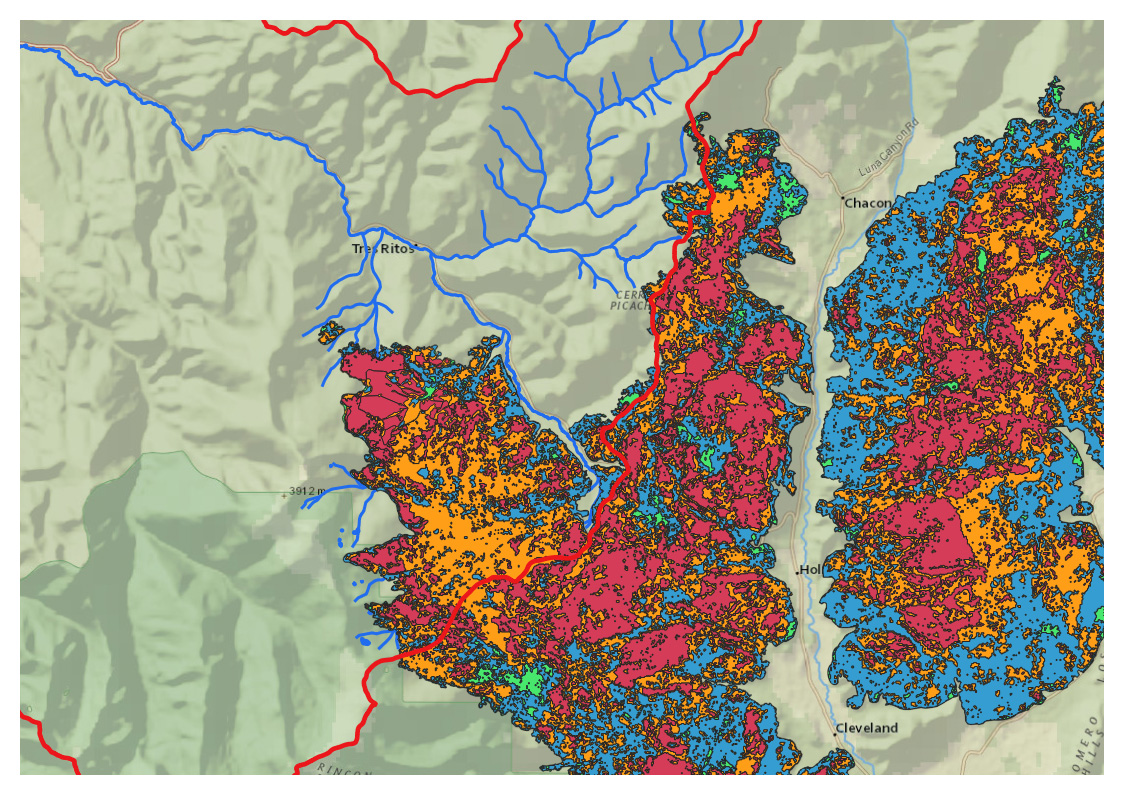
The green areas are "unburned" areas within the fire perimeter:
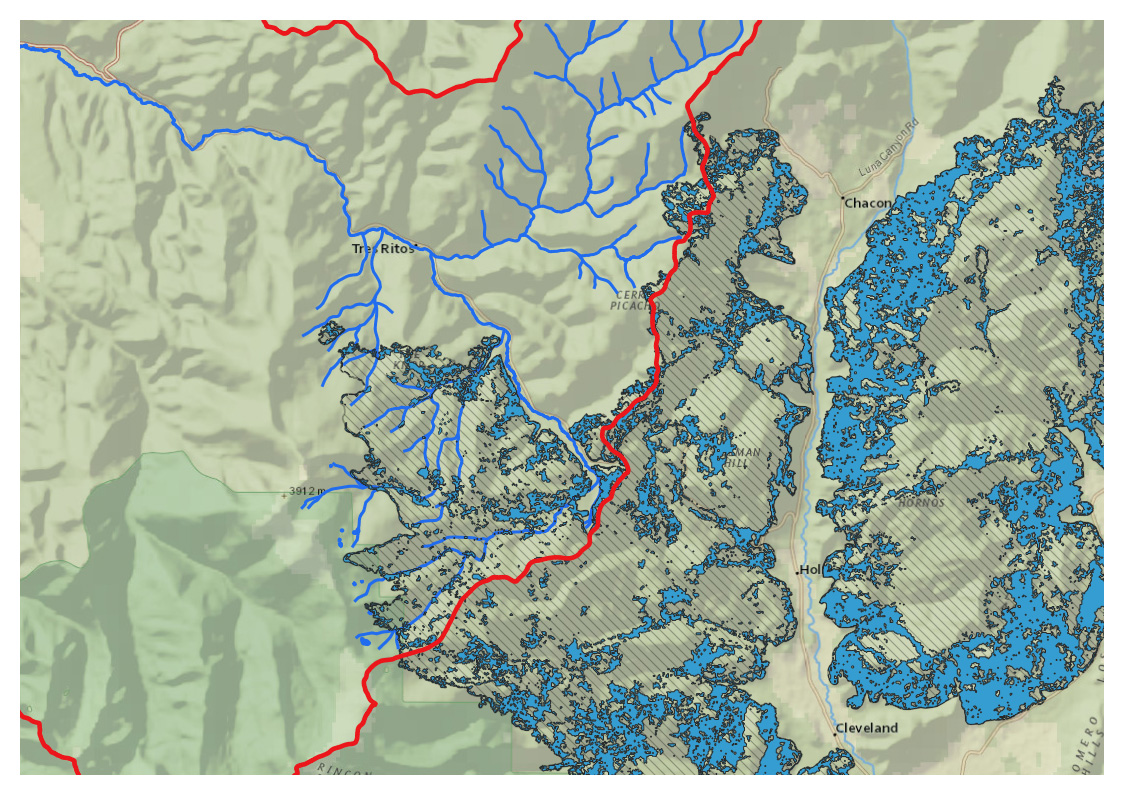
The blue areas are "low severity":
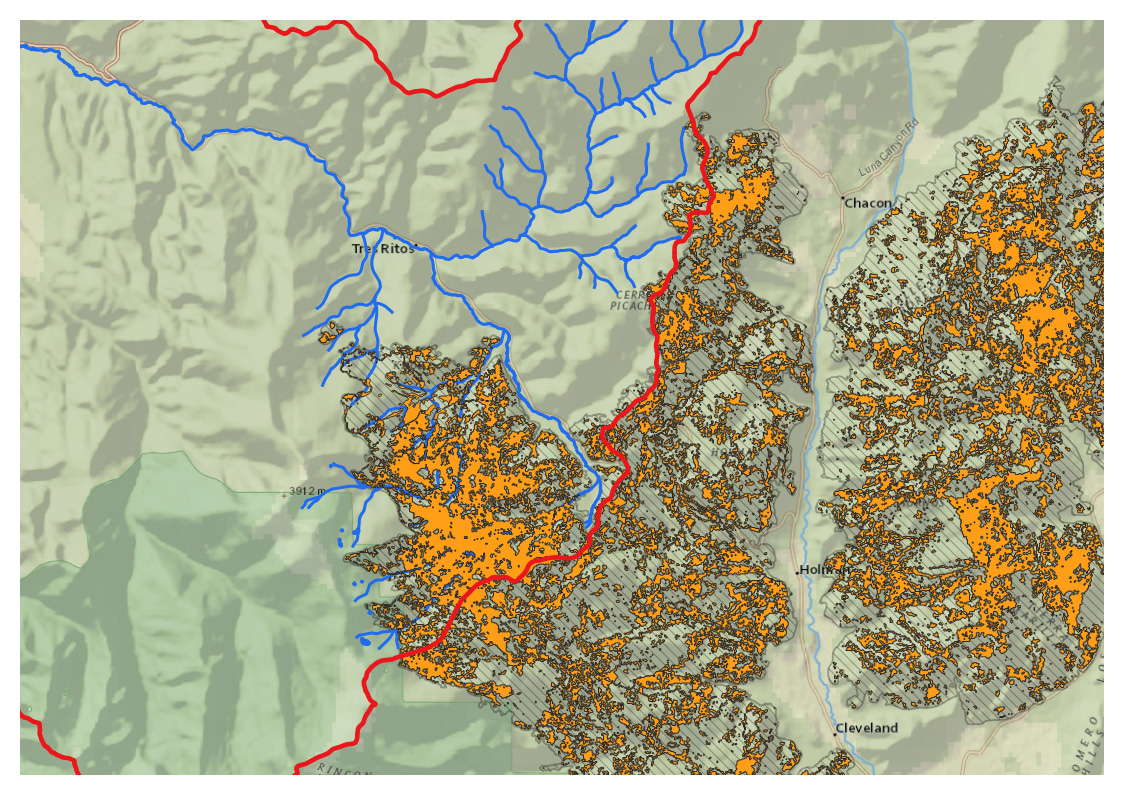
The orange areas are "moderate severity":
The red areas are "high severity":
Composite:
(red=high severity
orange = moderate severity
blue = low severity
green = unburned)
Maps and web presentation created by Robert Templeton (rt@rioembudobirds.org)